AI Analytics Is Replacing Static BI Dashboards.Here Is What Comes Next.
Companies spent two decades and billions of dollars building dashboards nobody opens on Monday morning. The replacement is not a better dashboard. It is a system that answers the question you actually have, in plain English, against your live data, in seconds.

The dashboard nobody opens on Monday morning
Walk through your office on a Monday morning and count how many screens are showing the BI dashboard your company paid to build. In most businesses the honest number is zero. The wall-mounted TV in the conference room cycles the same six charts it showed last quarter, and everyone has learned to look past it the way you look past hotel art.
This is not a small failure. Business intelligence has been one of the largest enterprise software categories for twenty years. Companies bought the licenses, hired the analysts, built the data warehouses, and commissioned dashboard after dashboard. The result, in company after company, is a graveyard of views that answered a question someone had in a planning meeting eighteen months ago and have not been touched since.
A growing chorus of data-science leaders is calling time on the dashboard era. Data scientist Matt Dancho put it bluntly: static dashboards do not answer dynamic business questions. Tools like Tableau and Power BI, in his framing, are heading toward extinction, displaced by a new breed of AI Analytics that combines large language models with SQL databases and machine learning to deliver real-time predictive insights. You do not have to accept the extinction claim at full strength to see that the underlying diagnosis is correct.
The problem was never the charts. The problem is that a dashboard is an answer to a question you asked in the past, and your business generates new questions every single day.
Why static BI is structurally broken
Notice the word structurally. This is not about picking a better BI vendor or hiring a better dashboard designer. The failure is baked into what a dashboard is: a fixed set of pre-computed views, defined by whoever was in the room when it was scoped, refreshed on a schedule, waiting for someone to come look at it. Four consequences follow, and every executive reading this has lived all four.
They answer pre-defined questions
A dashboard is a frozen snapshot of the questions someone thought to ask six months ago. Business does not hold still for the snapshot.
Every new question is a ticket
Want a cut the dashboard does not have? File a request, wait for the data team, get it in next sprint. The decision needed the answer this morning.
Insight latency runs in days or weeks
The gap between "something changed" and "we understand why" is where margin quietly leaks. Static BI institutionalizes that gap.
They show WHAT, never WHY or WHAT’S NEXT
A red number tells you revenue dipped. It does not tell you which segment drove it, whether it is seasonal, or what happens if you do nothing.
Play out the everyday version. Your Q2 revenue chart shows a dip in the Southeast. What you actually need to know is why: which accounts, which products, whether it is a timing artifact or a trend, and what the next sixty days look like if nothing changes. The dashboard cannot tell you any of that, because nobody pre-built those cuts. So you file a ticket. The data team, already underwater, gets to it Thursday. The analysis comes back the following Tuesday. The decision meeting was last Wednesday.
Multiply that loop by every meaningful question your leadership team asks in a quarter and you get the real cost of static BI. It is not the license fee. It is the compounding tax of decisions made late, made on gut, or not made at all because getting the answer was too much friction.

What is replacing it: AI Analytics
The replacement is conversational, real-time, and predictive. Instead of navigating to a view someone built for you, you ask a question the way you would ask your best analyst: “Aggregate sales for each territory.” “Which territories are trending down this quarter?” “What does the pipeline look like if the current close rate holds through September?” The system answers in seconds, with the numbers, the reasoning, and a recommendation.
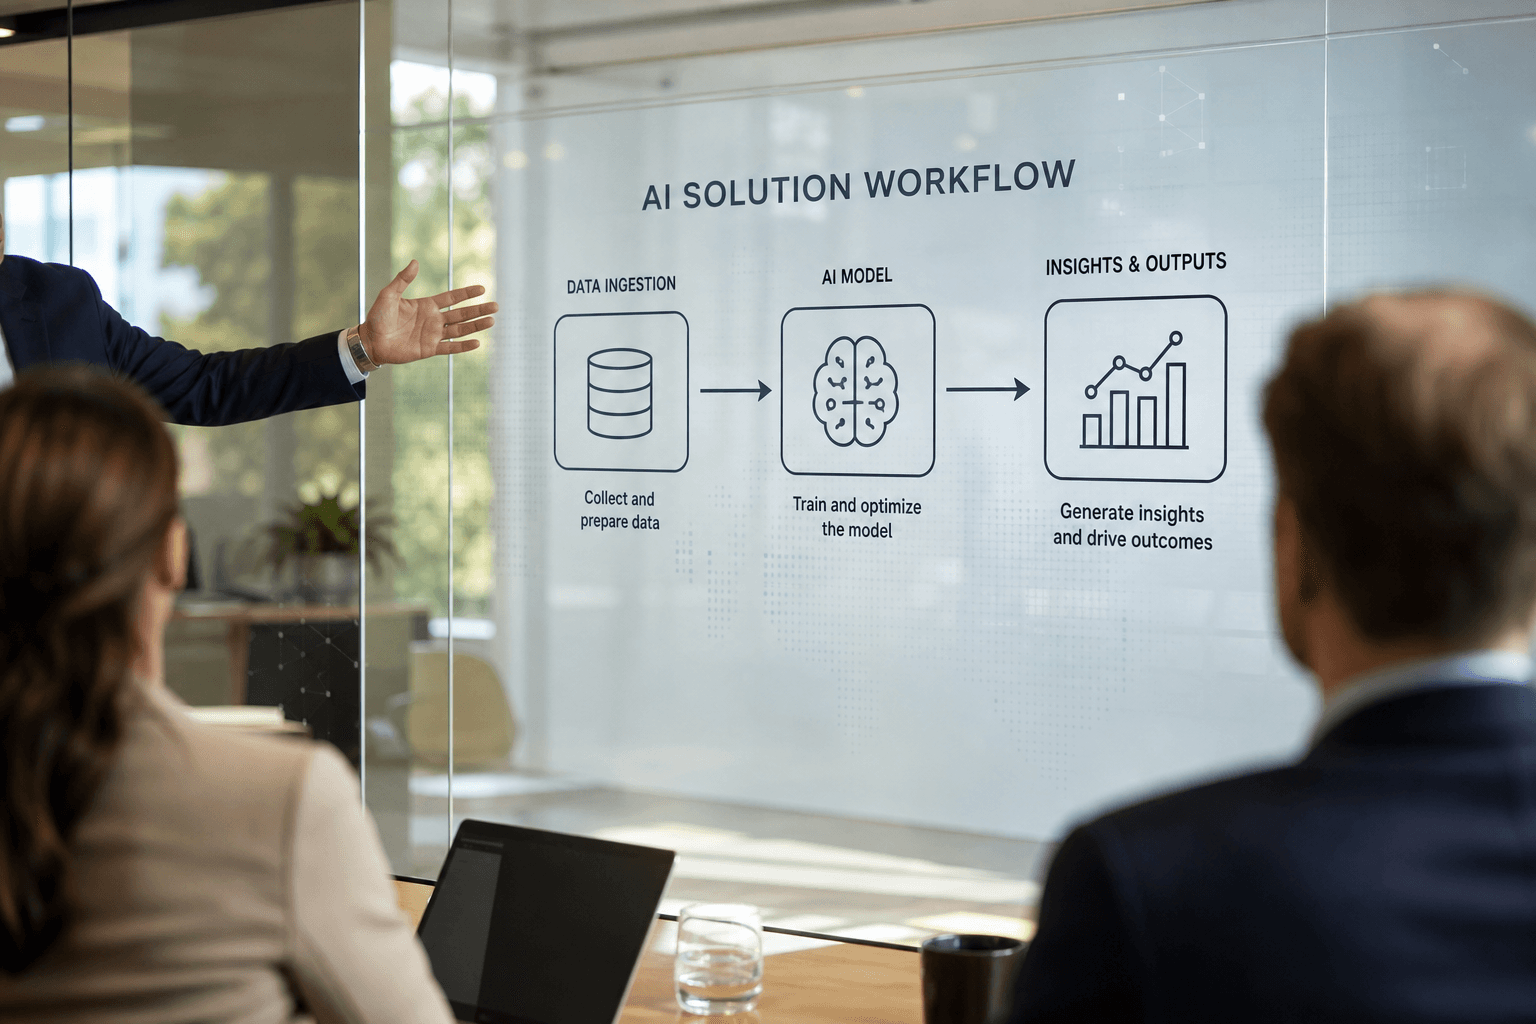
The stack behind this is worth understanding in plain English, because it is simpler than the vendors make it sound. There are four pieces, and the most important fact about them is that three of the four build on infrastructure you already own.
LLM orchestration
LangChain or LangGraph coordinating models from OpenAI or Anthropic. This layer understands the question, plans the analysis, and manages the steps.
Your existing SQL databases
Postgres, SQL Server, Snowflake, BigQuery. Nothing migrates. The agent queries what you already have, through read-only credentials.
Machine learning for prediction
Forecasting and anomaly-detection models the agent can call when the question is about the future: demand, churn risk, cash position.
Guardrails and observability
SQL validation, row-level security, cost caps, and full traces of every query the agent runs. The layer that separates a demo from a system.
Read that list again and notice what is missing: a data migration. This is the point executives most often get wrong about AI Analytics, so it deserves its own paragraph. You do not rip anything out. Your data stays exactly where it is, in the Postgres instance or the Snowflake warehouse or the SQL Server box you already run. The AI layer sits on top and asks your database questions the same way an analyst would, through SQL. If you have spent years getting your data into decent shape for BI, that investment carries over completely. In fact it is the prerequisite that makes this work.
The predictive piece is what separates this from a chat wrapper on a database. When the question is about the future, the orchestration layer can hand off to forecasting models: demand projections, churn scoring, cash-flow scenarios. The dashboard era answered “what happened.” This stack answers “what happened, why, and what happens next,” which is the sequence every real business decision actually requires.
Anatomy of a SQL Business Intelligence Agent
The workhorse of AI Analytics is the SQL Business Intelligence Agent. Strip away the branding and it is a four-step machine: it takes a question in plain English, writes and runs the SQL, interprets the results, and answers with narrative insight and a recommendation. The whole loop takes seconds. Here is what that looks like on a question every sales-driven company asks.
You ask
“Which territories are trending down this quarter, and why?”
The agent writes and runs the SQL
SELECT territory,
       SUM(CASE WHEN close_date >= '2026-04-01' THEN amount END) AS q2_sales,
       SUM(CASE WHEN close_date BETWEEN '2026-01-01' AND '2026-03-31'
           THEN amount END) AS q1_sales
FROM closed_deals
GROUP BY territory
HAVING SUM(CASE WHEN close_date >= '2026-04-01' THEN amount END)
     < SUM(CASE WHEN close_date BETWEEN '2026-01-01' AND '2026-03-31'
           THEN amount END) * 0.9
ORDER BY q2_sales / NULLIF(q1_sales, 0);
Then it drills down automatically: deal counts by rep, average deal size, pipeline coverage, and new-logo vs. expansion mix for each flagged territory.
The answer you get back, in seconds
“Two territories are trending down more than 10% quarter over quarter: Southeast (down 18%) and Mountain West (down 12%). The Southeast decline is concentrated in new-logo deals, which fell from 14 to 6 while average deal size held steady, and pipeline coverage for the rest of the quarter is 1.4x against your 3x norm, so the gap will likely widen without intervention. Mountain West volume is flat but average deal size dropped 15%, consistent with the discounting increase visible in that region since May. Recommendation: treat Southeast as a demand-generation problem and Mountain West as a pricing-discipline problem. They look identical on a dashboard and require opposite fixes.”
Sit with that last line, because it is the entire argument. On a revenue chart, Southeast and Mountain West are two red cells. Identical. The dashboard cannot tell you that one is a top-of-funnel problem and the other is a discounting problem, and it certainly cannot tell you that fixing them requires opposite plays. An analyst could tell you, after a few days of digging. The agent tells you before the meeting where you needed to know.
And because the interface is conversation, the follow-up is instant. “Show me the six Southeast new-logo deals we did close. What did those reps do differently?” No ticket. No sprint. The analysis goes as deep as your curiosity does.

What it actually takes in production
Here is the honest section, because the demo of this technology takes an afternoon and the production system takes real engineering, and conflating the two is how companies end up with an impressive prototype nobody is allowed to use. If you let a raw language model loose on your database, three things go wrong fast: it hallucinates queries against tables that do not exist, it misreads what your columns mean, and it happily hands any employee any answer it can compute. Production means closing every one of those doors.
Schema knowledge
The agent needs curated context: which tables matter, what "active customer" actually means in your data, which columns are landmines. Semantic-layer work, not prompt magic.
Guardrails against hallucinated SQL
Every generated query gets validated before execution: syntax checks, allowed-table checks, and result sanity checks. Bad SQL fails safely instead of returning confident nonsense.
Read-only credentials
The agent connects through a database role that physically cannot write, update, or delete. Not a prompt instruction. A permission the database enforces.
Row-level security
A regional manager asking about revenue should see their region, not payroll. Access control lives in the database layer, so the agent inherits it automatically.
Cost controls
Query timeouts, result-size limits, and per-user token budgets. An unbounded agent on a large warehouse is a surprise invoice waiting to happen.
Evaluation
A test suite of real business questions with known-correct answers, run against every model or prompt change. If you cannot measure accuracy, you cannot trust the system.
The demo-to-production gap is the whole game
Anyone can wire an LLM to a database in a weekend. The value, and the risk, live in the six items above. Budget your effort accordingly: roughly 20% getting the agent to answer, 80% making the answers trustworthy, safe, and affordable at scale.
This is exactly the kind of work Expert AI Labs does for clients. We consult businesses on AI end to end: the strategy of which questions and which data to start with, the implementation of the agent, guardrails, and evaluation suite, and the ongoing operations once it is live. And we hold ourselves to the standard of running on our own architecture: AI agents query our production database and write daily operating briefs for our own leadership, every morning, on the same stack we deploy for clients. You can see that system running on our proof page. We are not recommending a diet we do not eat.
Who should move now
Not every company needs to be first. But four profiles are leaving money on the table every quarter they wait, and if two or more of these describe you, the case for moving this quarter is strong.
You have data and a bottlenecked data team
Your analysts spend their week servicing ad-hoc report requests. An agent absorbs the routine 80% and frees them for the hard 20%.
Your leadership meetings run on stale exports
If the Monday deck is built from last Wednesday’s CSV, decisions are being made on old data by default. Real-time answers change the meeting.
You sell across territories, segments, or SKUs
Multi-dimensional businesses generate more questions than any dashboard can pre-build. This is exactly where conversational analytics pays off first.
You already pay for BI nobody opens
Low dashboard engagement is not a training problem. It is a product-shape problem. Meet people where they already ask questions: in plain English.
One caveat, stated plainly: if your underlying data is a mess, fix that first. An agent querying wrong data gives you wrong answers faster and more confidently than a dashboard ever did. The good news is that a scoped pilot exposes data-quality problems immediately, which is itself worth the exercise.
Your first 30 days
You do not need a transformation program. You need one database, ten questions, and four disciplined weeks. Here is the plan we run.
Week 1
Inventory the questions. Pull the last 90 days of ad-hoc report requests and meeting questions. Rank by frequency and decision value. Pick one database and the top ten questions.
Week 2
Stand up a read-only pilot. Read-only credentials, a curated schema description for the tables involved, and an agent scoped to those ten questions. Keep it internal.
Week 3
Evaluate hard. Run every question daily. Compare agent answers to analyst-verified answers. Log every wrong or ambiguous result and fix the schema context, not just the prompt.
Week 4
Put it in one real meeting. Replace one recurring report with live agent answers in your weekly leadership sync. Measure what changes: questions asked, decisions made, tickets not filed.
At the end of thirty days you will know three things with certainty: whether your data can support conversational analytics, which questions your organization actually asks when the friction drops to zero, and what the honest gap is between pilot and production for your environment. That is a better position than most enterprises reach after a year of BI committee meetings.
The dashboard era ran on a bargain: you accept pre-defined questions and days of latency, and in exchange you get charts. That bargain made sense when computers could not understand English or write SQL. They can now. The companies that internalize this first will spend the next five years making faster, better-reasoned decisions than competitors still filing tickets for a new dashboard filter. The tooling is ready. The only open question is who moves.
Put an AI analyst on your database
We will map your highest-value questions to a scoped, read-only pilot and show you the same architecture running live on our own production data. Start with a conversation, or size the opportunity yourself with the free AI ROI Calculator.
Frequently asked questions
Do we have to replace Tableau or Power BI?
No. Your existing BI tools keep doing what they are good at: standardized reporting, compliance views, board decks. AI Analytics sits alongside them as the layer for dynamic questions. Most companies we work with keep their dashboards and stop expanding them, routing new analytical demand to the conversational layer instead.
Is it safe to let AI query our database?
Yes, if it is engineered correctly. The agent connects through read-only database credentials it cannot escalate, row-level security limits what each user can see, every generated query is validated before execution, and every run is logged. The safety comes from database-enforced permissions and guardrails, not from trusting the model to behave.
What does AI analytics cost?
Far less than most executives expect, because you are not migrating data or buying a new platform. Costs are the implementation work (schema context, guardrails, evaluation) plus per-query model usage, which for typical business questions runs in cents. The comparison that matters is against the fully loaded cost of analyst hours spent on ad-hoc report requests.
How long does implementation take?
A scoped read-only pilot on one database with a defined question set takes two to four weeks. Production hardening (row-level security, evaluation suites, cost controls, rollout to more teams) typically runs another four to eight weeks depending on how many systems and user groups are involved.